A covered-call ETF can show a 10% or 12% yield and send you cash every month, so it’s easy to think of it as a paycheck that can’t break.
The short answer is no. A covered-call ETF gives you fairly dependable cash flow, but your principal isn’t protected. In every major downturn since 2015, these funds kept paying. Their share prices still fell about as hard as the market, and several are still below where they stood before the 2018, 2020 and 2022 drops.
Here’s what the real history shows, using daily price and distribution data for QYLD, XYLD, JEPI, JEPQ and SPYI, compared with SPY and QQQ.
New to this fund type? Start with Growth vs Dividend vs Covered Call ETFs. For the history of the strategy and since-inception returns, see Do Covered Call ETFs Beat the S&P 500?.
How the income actually works
A covered-call fund owns stocks, often an index like the S&P 500 or Nasdaq-100, and sells call options on them. Buyers of those calls pay a premium, and the fund passes that premium on to you as a monthly distribution.
Three things follow from that design:
- Premiums rise when markets get scary. Option prices go up with volatility. J.P. Morgan says it plainly for JEPI: “Options premium generated can vary dependent upon market volatility; as volatility increases, the potential for incremental income and upside also increases.” So payouts can hold up, or even rise, right when the share price is falling.
- Your upside is capped. FINRA describes a covered call as generating premium income “with the risk of potentially losing the upside appreciation of the shares.” Global X notes that covered call writing “can limit the upside potential.” When the market rips higher, you only get part of it.
- Some of the payout may be your own money. Global X states that QYLD’s “distributions may contain return of capital.” NEOS says SPYI’s distributions “have been classified as a return of capital.” Return of capital (ROC) isn’t automatically bad, and it can be tax-efficient. But a high yield doesn’t prove the fund is earning that much.
What happened in each downturn
Here’s how the funds held up through five drops, plus a smaller one in early 2026. “Payout change” compares the average monthly distribution per share in the 12 months before the downturn with the 12 months after the bottom. “Rebound vs SPY” is the share of SPY’s 12-month total return (from SPY’s low) that the fund captured.
| Downturn | Fund | Price drop | Payout change | Price back to old peak? | Rebound vs SPY |
|---|---|---|---|---|---|
| 2015–16 correction | QYLD | -14.2% | +2% | Yes (about 20 months) | 70% |
| XYLD | -15.9% | -36% | Yes (12 months) | 80% | |
| SPY | -14.4% | — | Yes (5 months) | 100% | |
| Q4 2018 | QYLD | -20.8% | flat | Not yet | 80% |
| XYLD | -19.3% | -16% | Not yet | 68% | |
| SPY | -20.2% | — | Yes (4 months) | 100% | |
| COVID 2020 | QYLD | -25.5% | +12% | Not yet | 52% |
| XYLD | -34.1% | +44% | Not yet | 66% | |
| SPY | -34.1% | — | Yes (5 months) | 100% | |
| 2022 bear market | QYLD | -31.0% | -29% | Not yet | 109%* |
| XYLD | -25.0% | -4% | Not yet | 65% | |
| JEPI | -19.3% | +28% | Not yet | 66% | |
| SPY | -25.4% | — | Yes (15 months) | 100% | |
| 2025 tariff drop | QYLD | -20.6% | -10% | Not yet | 85% |
| JEPI | -14.4% | +13% | Yes (11 months) | 60% | |
| JEPQ | -21.6% | +14% | Yes (6.5 months) | 103% | |
| SPYI | -18.2% | flat | Yes (5.4 months) | 90% | |
| SPY | -19.0% | — | Yes (2.6 months) | 100% |
QYLD’s 2022 rebound looks strong against SPY because it started from a deeper low. Against QQQ, its own index, it captured only 62%.
In early 2026, SPY fell about 9% and QQQ about 12% between January and March. The covered-call funds lost about 5% to 9% on a total-return basis and have mostly recovered since.
What stands out: the cushion was small. In 2020, XYLD’s price fell 34.1%, the same as SPY. In 2022, QYLD fell 31.0% while SPY fell 25.4%. Selling calls takes a few points off a crash at best. It doesn’t stop one.
The share-price problem
This is the part a yield number hides. Here’s QYLD from December 2013 to October 19, 2026:
- Share price: -27%
- Total return with distributions reinvested: +189%
- QQQ total return over the same period: +839%
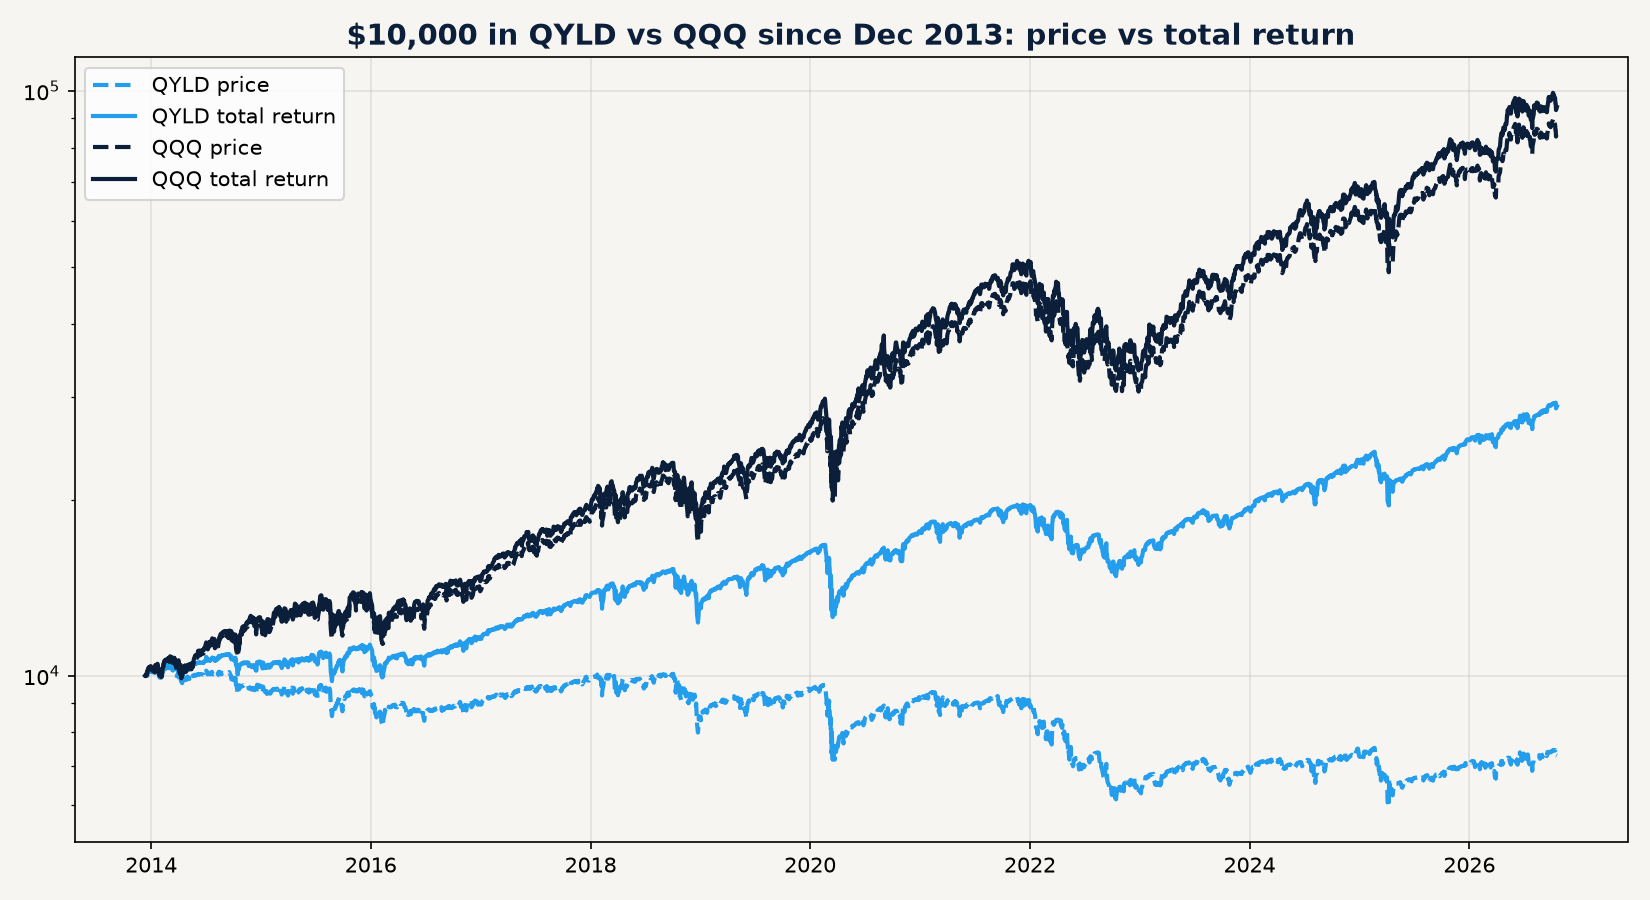
That gap between -27% and +189% is the distributions. Reinvest every payout and you came out well ahead. Spend every payout and you’re left holding shares worth about a quarter less than you paid. Because the price never got back to its 2018, 2020 or 2022 peaks, each crash permanently shrank the pile of shares paying your income.
XYLD shows the same pattern: its price is up about 4% since mid-2013, while its total return is about 194% and SPY’s is about 510%.
Payouts aren’t a fixed coupon
A bond pays the same coupon whether markets are up or down. A covered-call fund doesn’t:
- QYLD’s monthly payout per share fell about 29% in the year after the 2022 bottom, compared with the year before.
- XYLD’s fell about 36% after the 2015–16 correction.
- JEPI’s rose about 30% during 2022 as volatility pushed option premiums higher.
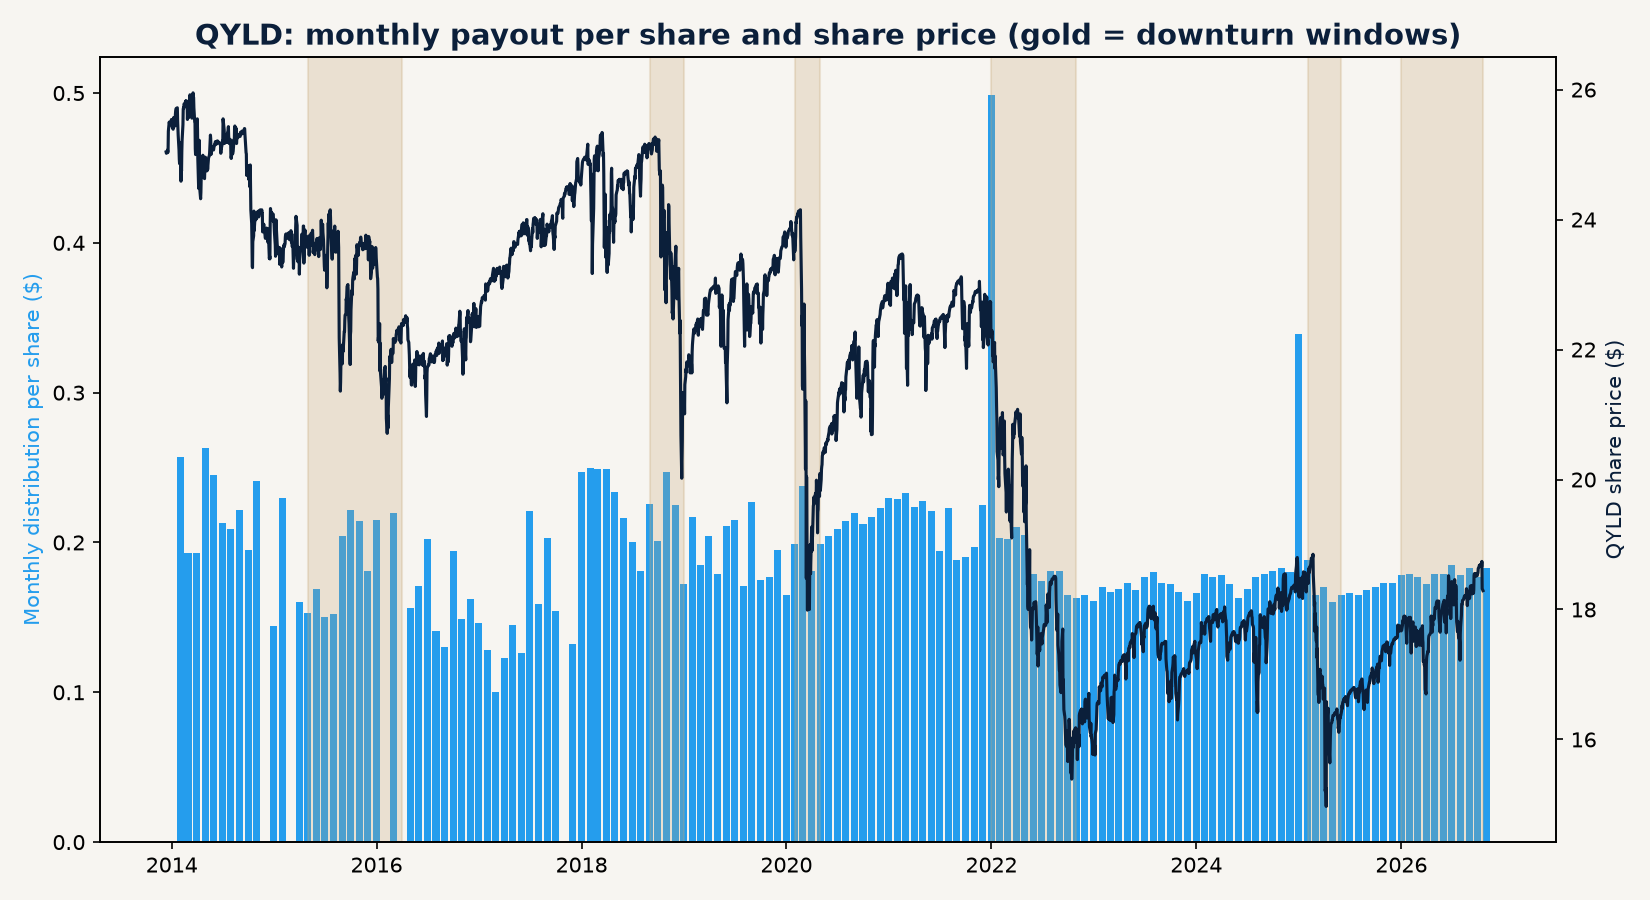
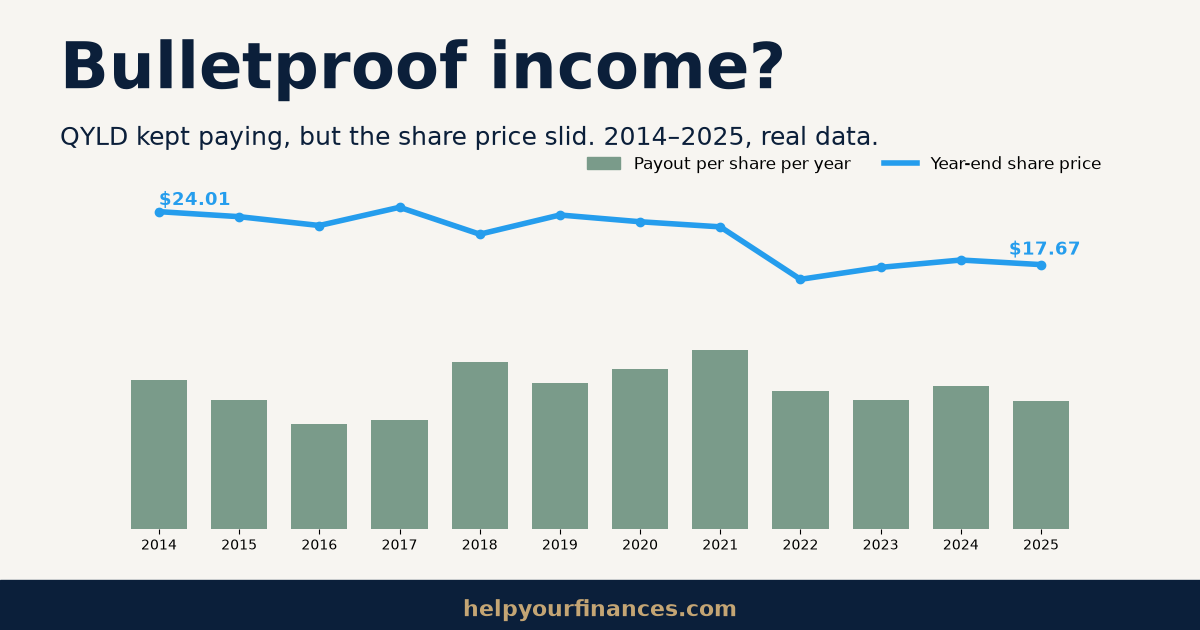
Over the long run, QYLD paid about $2.38 a share in 2014 and about $2.32 in the 12 months to October 2026, so roughly flat in dollars for 12 years. Over the same years, SPY’s annual payout per share nearly doubled, from $3.84 to $7.28. Flat income on a shrinking share price, with no raise for inflation, is the opposite of bulletproof.
Newer designs: better in 2025, short track record
Newer funds don’t simply sell at-the-money calls on everything:
- JEPI uses out-of-the-money call exposure (through equity-linked notes) on part of the portfolio over a defensive stock portfolio.
- SPYI uses S&P 500 index options and manages its calls more actively.
- JEPQ applies the JEPI approach to the Nasdaq-100.
In the 2025 tariff drop, SPYI’s price recovered in about 5.4 months and JEPQ’s in about 6.5. Both captured 90% or more of SPY’s rebound and kept their payouts steady or rising. That’s a real improvement over QYLD and XYLD.
The catch is history. SPYI and JEPQ both launched in 2022, and JEPI in 2020. None of them has been through a long bear market from start to finish, so “better so far” isn’t the same as “proven.”
How to use them sensibly
Covered-call ETFs can still be useful if you treat them as a tool, not a fortress:
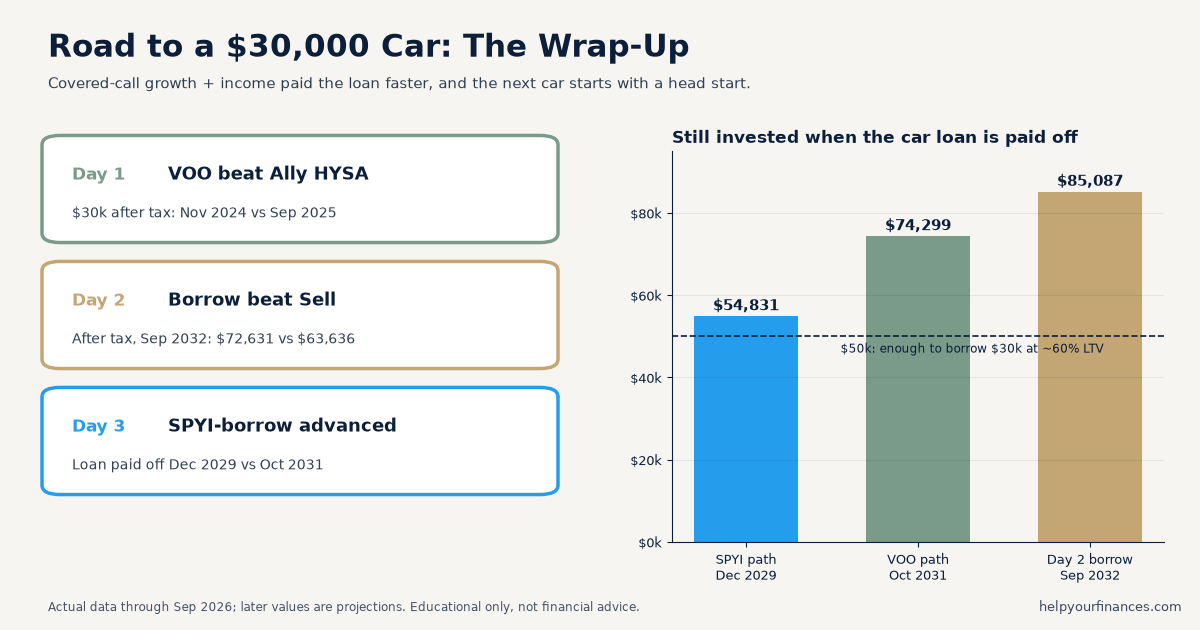
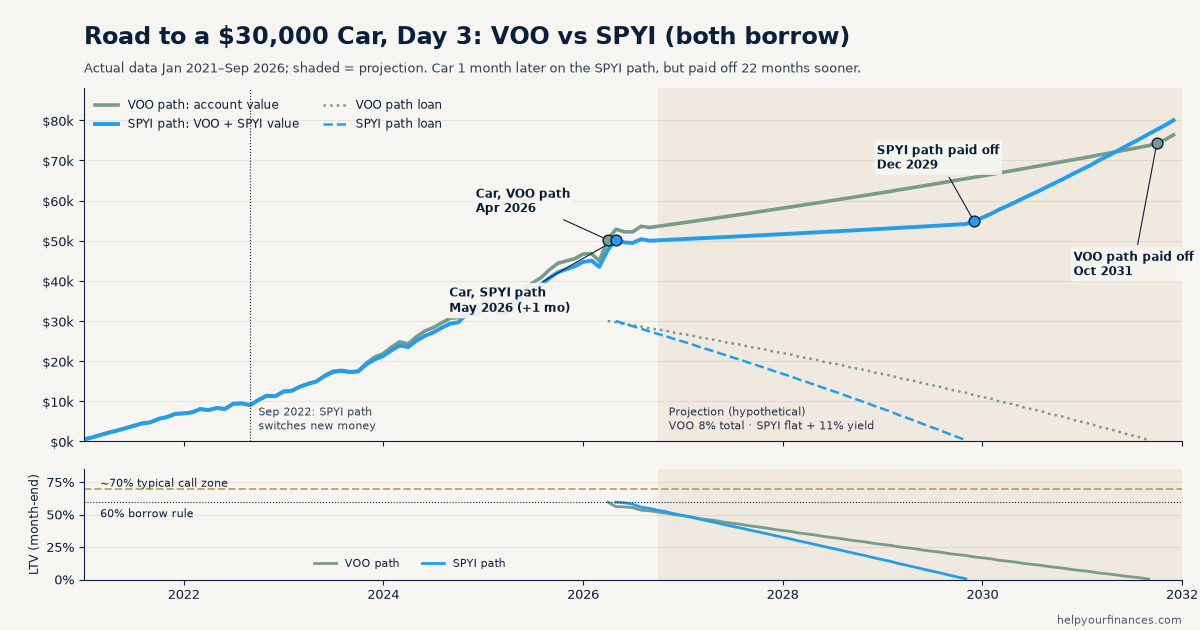
- Make them a sleeve, not the whole portfolio. Pair them with growth holdings like VOO or QQQ so a capped upside doesn’t cap your whole future. Our Road to a $30,000 Car wrap-up shows one way income and growth can work together.
- Reinvest some of the payout. Even reinvesting part of it helps rebuild the shares lost in downturns.
- Know the tax treatment. Distributions are often taxed as ordinary income. Some funds label part of the payout as return of capital, which lowers your cost basis instead of being taxed right away. SPYI uses index options that are section 1256 contracts, which NEOS says get “lower 60/40 tax rates.” Check each fund’s 19a-1 notices and your 1099.
- Judge them by total return, not yield. A 12% yield on a falling price can be worth less than a 1% yield on a rising one. Before buying, compare a fund’s price chart and total return with SPY or QQQ over the same dates.
- Plan for a lower payout in a downturn. Check whether your budget still works if the payout drops 30%, because it has happened before.
For practical ways to set up a monthly-income sleeve, see Maximize Monthly Income with Covered Call ETFs.
The bottom line
Are covered-call ETFs bulletproof income? No. The cash kept coming through every crash since 2015, which makes it fairly dependable cash flow. But the share price fell almost as hard as the market, the dollar payout sometimes dropped 30% or more, and older funds like QYLD and XYLD still haven’t recovered their pre-crash prices. Use them for income alongside growth, reinvest some of what they pay, and keep an eye on total return.
Data: Yahoo Finance daily prices and distributions, through October 19, 2026. Total return assumes distributions are reinvested and ignores taxes and trading costs.
Educational only, not financial advice. Past performance doesn’t guarantee future results.
Sources
- Global X, QYLD fund page (covered-call strategy; “distributions may contain return of capital”; “covered call writing can limit the upside potential”): https://www.globalxetfs.com/funds/qyld/
- J.P. Morgan Asset Management, JEPI Fund Story, June 30, 2026 (premium varies with volatility; may forgo a portion of the market’s upside): https://am.jpmorgan.com/content/dam/jpm-am-aem/americas/us/en/literature/fund-story/STO-JEPI.pdf
- NEOS Investments, SPYI fund page (distributions classified as return of capital; section 1256 contracts, 60/40 tax rates): https://neosfunds.com/spyi/
- FINRA, Options (definition of a covered call): https://www.finra.org/investors/investing/investment-products/options
- Price and distribution data: Yahoo Finance (QYLD, XYLD, JEPI, JEPQ, SPYI, SPY, QQQ), https://finance.yahoo.com/